Veyo Technology: Connecting Segment to Google Analytics
May 23, 2018

NOTE: This is part 3 of a series on tracking analytic events in Angular projects using Segment.
You can find the other parts of the series here:
Part 1: Incorporating Segment in an Angular App
Part 2: Using Angular Environments to Configure Multiple Segment Sources
You can also find the codebase referenced in the previous articles on GitHub: https://github.com/veyo/webapp-analytics
Intro
This article is going to provide steps to visualize your Segment data with Google Analytics. By the end, you’ll know how to create reports and share them with your team.
Make sure you read the previous articles in this series. The code samples assume that you have an Angular app utilizing the Angulartics library.
I suggest reading the whole article before adding your own events since I’m going to provide a few different options. You’ll also want to avoid copying and pasting the code samples since I’m going to provide different solutions that might not work for your specific use case.
Why Google Analytics?
Google Analytics is by no means the best analytics tool.
It is developed to help with SEO and has a strong focus on eCommerce. However, it’s free, easy to share access with your team if you’re already using Google tools, and it’s straight forward. New features are constantly being added (arguably, too frequently…) which is a good sign when you want to rely on a tool for a long time. Every few months there’s some new insight added to the platform that lets you pull more value out of your existing data. Finally, because it’s a Google product, most of your colleagues will already have experience with it.
Connect
Getting Segment communicating with Google Analytics is easy. You can do it all through Segment’s UI without needing to deploy any code – the main reason I love Segment so much! All you need to do is follow the instructions when adding a new Google Analytics Destination.
A couple things to watch out for:
- You should not have the Google Analytics Tracking Code on your pages. This will cause duplicate data.
- It can take up to 10 minutes for the data displayed in Segment’s reporting to show up in Google Analytics although, in my experience, this has been almost instant.
Data Structure
Google Analytics expects 4 properties: Action, Category, Label, and Value.
When defining Angulartics Events, make sure to follow that structure:
[pastacode lang=”javascript” manual=”analytics.track(‘Add%20To%20Cart’%2C%20%7B%0A%C2%A0category%3A%20’Electronics’%2C%0A%C2%A0label%3A%20’Backlit%20LED%20Keyboard’%2C%0A%C2%A0value%3A%203%0A%7D)%3B” message=”” highlight=”” provider=”manual”/]
This will be tied to:
- Action: Add to Cart
- Category: Electronics
- Label: Backlit LED Keyboard
- Value: 3
As you can see, Action is provided as the only required property. If you don’t provide the other values, Category will be “ALL”, while Label and Value will be blank.
If you use Google Analytics dashboards, I strongly suggest using the “category” and “label” property names in your events. With this structure, it’ll be very easy to throw together dashboards and reports, as well as quickly filter your data through Google Analytics’ web tools. Again, it’s not a perfect tool, and if you know how to query your Segment store, you may not need Google Analytics at all, but if you want a super simple UI for your team this will save tons of time.
Now what if you need to use a custom data structure, or 4 properties isn’t enough?
Custom fields
Let’s say we already have this event that tracks a user adding 3 keyboard products to a shopping cart from a product details screen:
[pastacode lang=”javascript” manual=”analytics.track(‘Add%20to%20Cart’%2C%20%7B%0A%C2%A0section%3A%20’Electronics’%2C%0A%C2%A0item%3A%20’Backlit%20LED%20Keyboard’%2C%0A%C2%A0quantity%3A%203%2C%0A%0A%C2%A0screen%3A%20%C2%A0’Product%20Details’%0A%7D)%3B” message=”” highlight=”” provider=”manual”/]
In this example, we not only have extra data that we didn’t supply before, but we’re not following the “Google Way” at all. If we left our event like this and deployed then our dashboard would only show that the “Add to Cart” action had been triggered.
To configure Google Analytics we’ll need to add Custom Dimensions. Because Google Analytics’ UI changes so frequently, I’m going to direct you to the official instructions: https://support.google.com/analytics/answer/2709829?hl=en
Once the dimension is defined in Google Analytics, you need to tell Segment how to link the event property to the specific dimension ID.
Back in Segment, from the Destination details screen, you’ll find a section for custom dimensions in the Advanced Options menu. From here, use the dropdowns to select which of your named properties (such as “Quantity”) should be linked to the Google Analytics custom dimension (for example: dimension2).
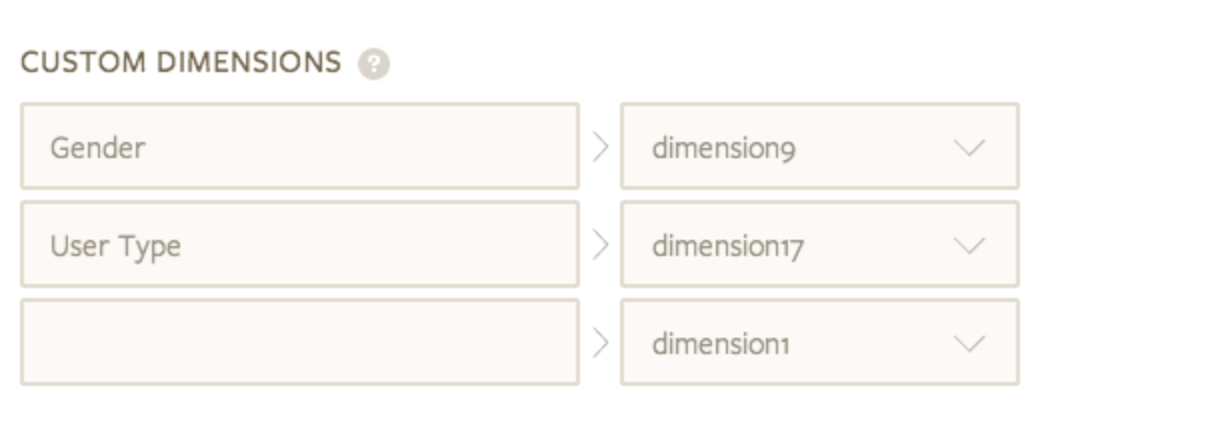
If you don’t see your event property, remember that Segment generates the analytics schema based on events that have been provided. For the property to show up in the dropdown list, you need to send an example event to Segment.
Reports on custom fields
As I said before, Google Analytics dashboards work great with the default action/category/label properties but not custom ones. To visualize your custom dimensions, create reports and select the dimension when adding filters.
Custom dimensions in Google Analytics seem cool, but they’re difficult to configure and you’re limited to only a few dozen. If you’re getting to the point where your business depends on custom metrics in UX analytics reports, consider another tool.
Conclusion
Now that you’re able to pass your analytics events to a visualization tool, start playing around with graphs to see how your users are interacting with your app. Are your assumptions correct? Let your team know how they can access the dashboard and see what kind of reports they come up with. I’m always surprised at how many different conclusions you can determine with the same dataset being viewed by multiple perspectives.
– AJ Zane, Front End Engineer at Veyo